Energy Sector - XLE - Why I Am Selling Oil
I put a trade on in at the start of the year on XLE stock - The Energy Sector ETF. I am not out and here is why


I went long XLE stock at the beginning of the year as I felt the energy sector was undervalued. I bought XLE stock on January 4th for about $85.00. I took profits on 50% of that at $95.00. Shortly thereafter, I took the remaining profits on my XLE stock trade at $92.50 when the economy started to show signs that there are serious cracks. The economic data is starting to show that the consumer is spent and there will be a lack of growth for economic activity that is already starting to show signs of consumer fatigue from high inflation and price pressures as well as the resulting higher interest rates to tame said inflation.
While I made profits from my XLE stock long position, I do not necessarily believe it was because I was an eternal genius on the call so much as it is that the broader stock market rallied and XLE stock components went up along the way. That being said, overall the economy is showing signs of slowing - and companies are reporting lower foot traffic.
Because of this, if the economy slows further, there will be a buildup of supply for oil. Then, it becomes a race to the bottom. As margins for energy producers shrink from a lower selling price on the price of oil, producers try and produce even more oil in order to keep the profits rolling in. Supply builds up even more because consumers are already consumer less - layoffs will occur resulting in less gas usage and goods being shipped across the country decline.
The result? Lower and lower oil prices and by extension, XLE stock moves lower. I am selling XLE stock and USO stock again. I am targeting about $50.00 on USO stock which should pull XLE stock down to ~$60.00 from the current $93.55.
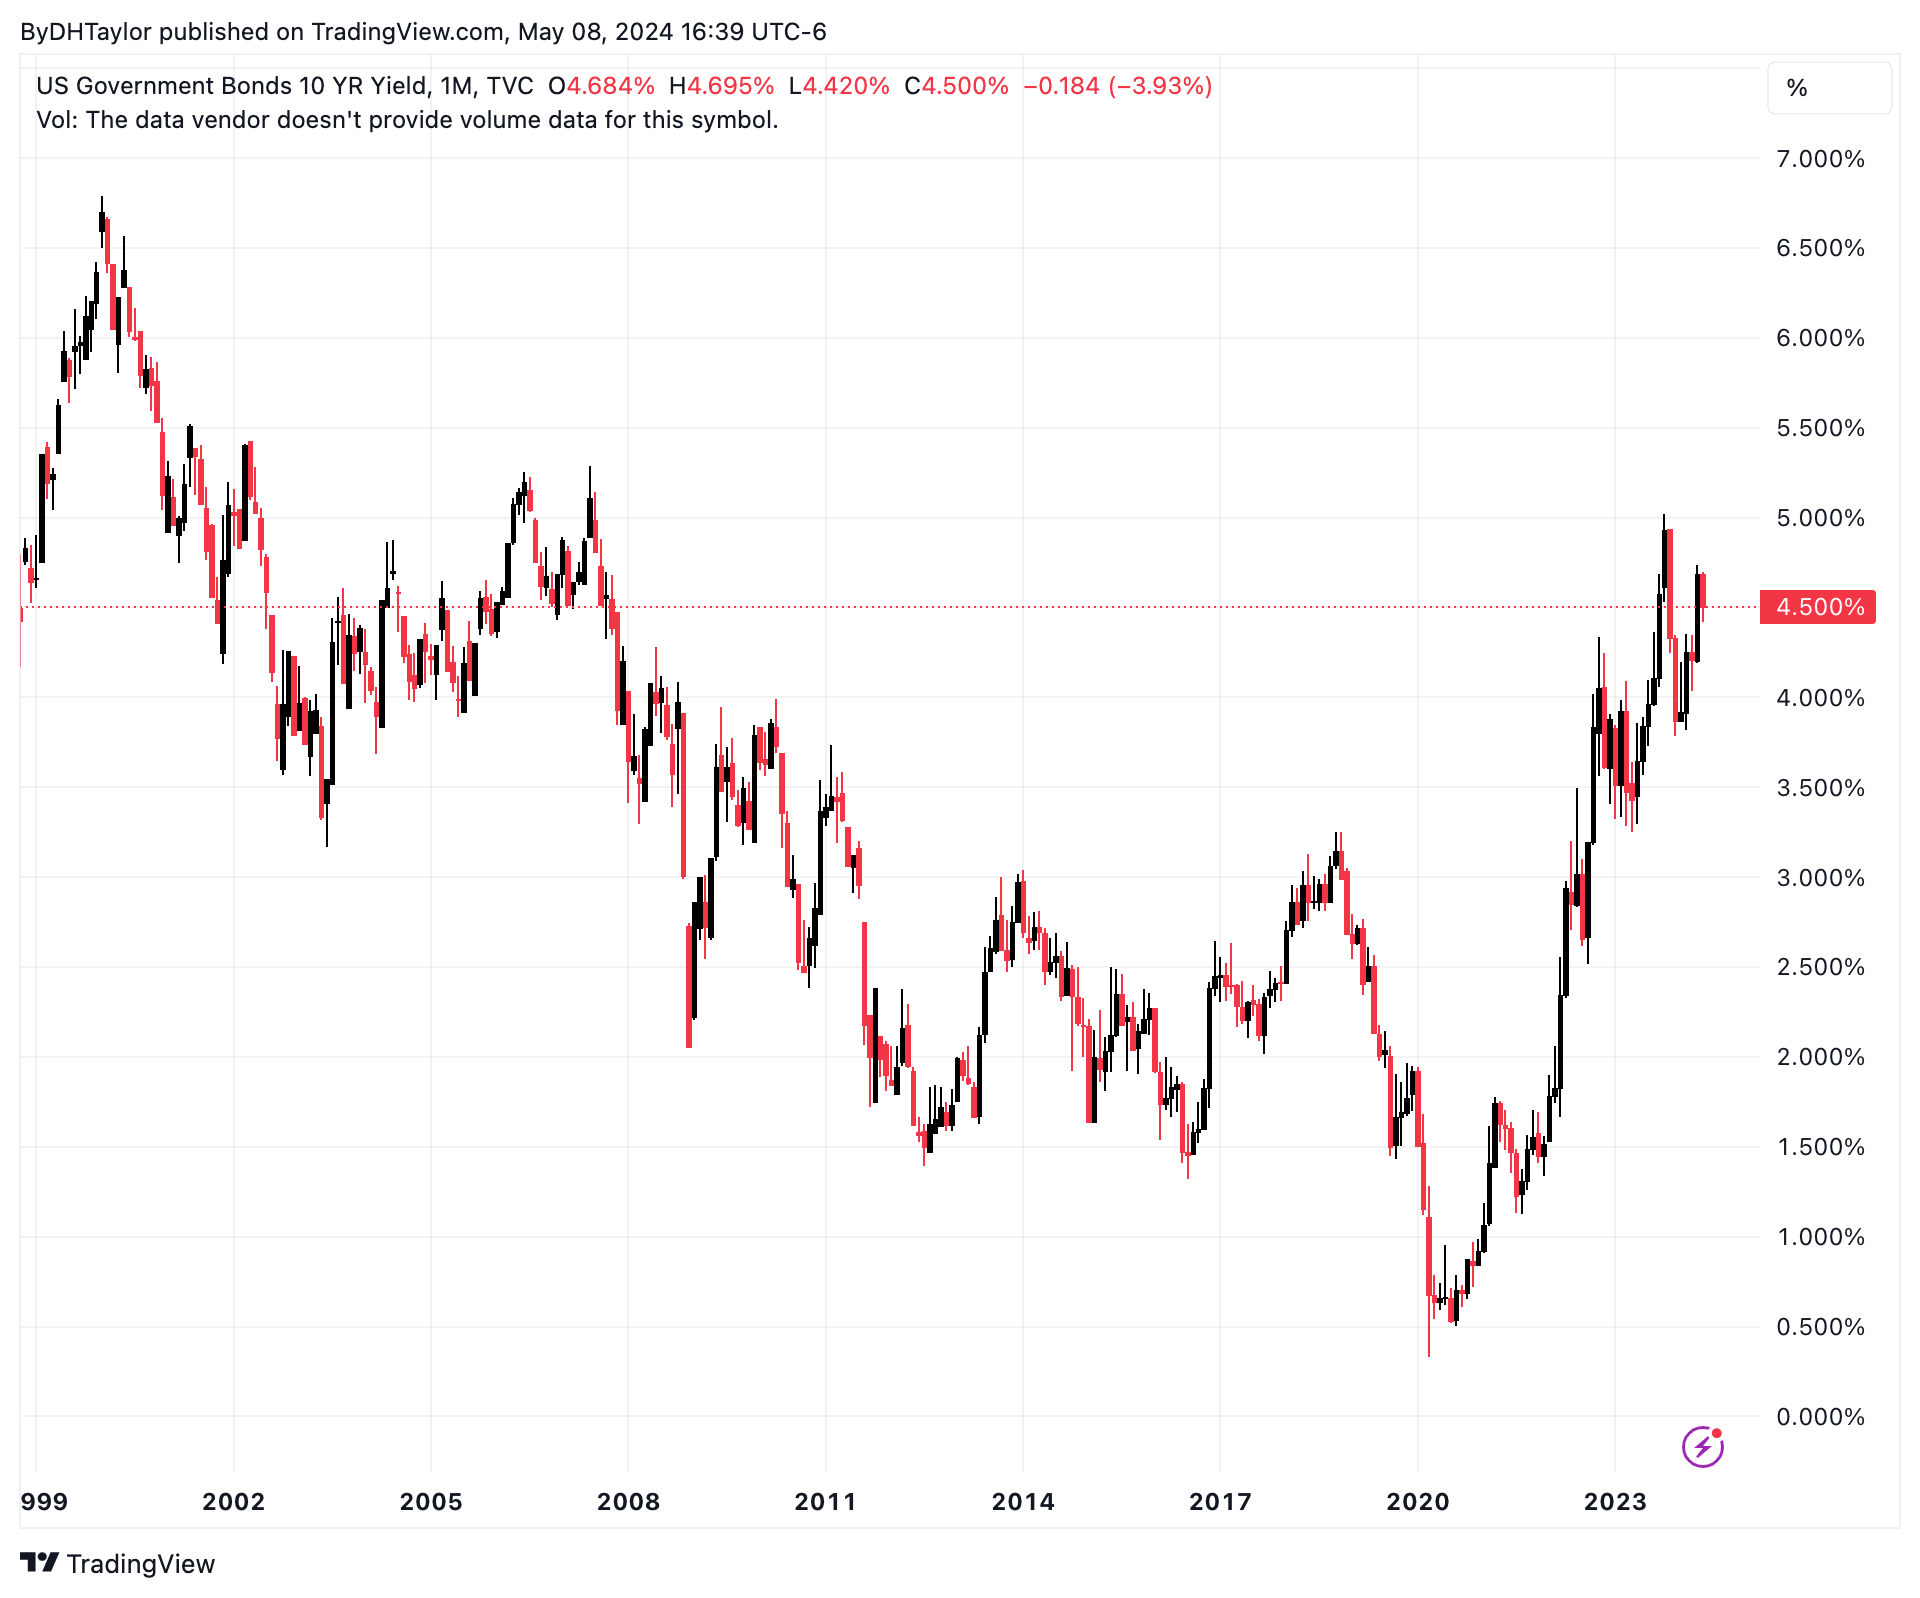
Oil Prices Versus Interest Rates

Above, I am comparing WTI - or the price of oil, versus the US 10 Year Treasury yield. There are obvious ebbs and flows with interest rates and the economy overall when you look at both of these.
If the economy expands, demand for oil increases. Interest rates follow as an expanding economy merits higher levels of interest rates in order to contain potential price pressures. But, at this point, interest rate levels are exceeding price levels for oil. When I saw this chart, to me it states that the higher-for-longer interest rates are containing the price of oil. Demand will have waned and during this period, supply could build up and keep prices lower.
What happens next is a race toward the bottom for supply and the price of oil.
Cracks In The Economy
Because of aggregate price pressures on all products, the Federal Reserve raced to bring interest rates up to levels that would contain these price pressures. This sharp increase is having an affect on overall growth rates in the economy. And, I believe this is just the beginning - the driving factor for my selling into higher levels of the price of oil.
Companies Seeing Declining Consumer Activity


Above are charts on some of the companies that have reported surprise results that were less-than-desirable. These companies all same the same thing: The consumer is fatigued and tapped out. Foot traffic at Starbucks is down 4% worldwide, Disney will be seeing zero growth next quarter, Uber is seeing less rides altogether, and even Mc Donalds & Yum Brands are seeing less foot traffic.
This is just the beginning. These companies above will start to remedy as best they can in order to protect the bottom line as best they can. The solution? Layoffs. On aggregate, across the country, companies will start to let employees go and this begins the process of a snowflake at the top of a mountain gaining size and speed. But, this is just the beginning.
Initial Jobless Claims Will Climb

This week, a slight pop higher in US initial jobless claims hit. These are the individuals that are filing - for the first time - jobless claims based upon circumstances beyond their control. The chart above is hardly indicative of a big problem when you look at it as it is. But, there is evidence around that suggest this is the beginning and what comes next is more and more layoffs.
I still focus the beginning of my analysis on personal incomes and personal expenditures, and the rate of growth of both of these. The rate of growth of personal incomes has gone flat, and I believe it will start to trend lower. Consumption will follow, and is already showing up in company revenues.
The effects of higher interest rates for longer are being felt.
At this point, with a resilient economy, the above may be nothing more than an accumulation of normalized numbers on growth - which have been above normal. But, the Fed’s current position may not shift for at least six months as they will not want to make moves prior to the US Presidential election. This means that debt beings serviced by consumers will be done so with higher-for-longer interest rate levels, which will be punitive to finite income levels.
Eventually There Will Be Blood In The Streets

I expect that since we have interest rates where they are, and since the consumer is pulling back, USO stock will decline - if, but modestly. That will eat into profits for energy producers, those within XLE stock. Those producers, in a bid to protect profits, are going to produce as much as they can, and that will drive supplies higher, and prices lower. With marginal profits declining, XLE stocks will see their individual share prices decline.
This is the snowflake at the top of the mountain.
I am not there yet that we see a recession. We are already seeing the beginning of economic growth contracting. What we do not know is how far the shrinking of the economy will be. But, I believe it will be enough that the Fed will have to lower interest rates sharply. This will reignite economic expansion. But, how far lower will there be an economic contraction and then how much lower will interest rates decline thereafter?
And, for this specific trade, how much lower will USO stock move, and by extension XLE stock?