
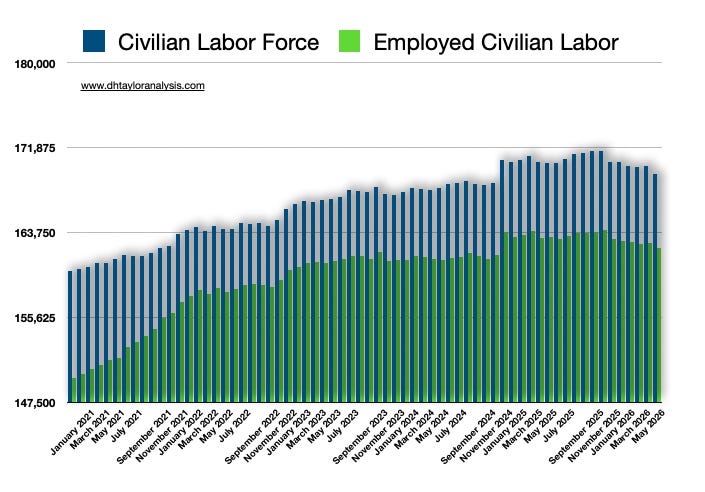
The above chart caught the eye of Wall Street last week on release of the employment situation—I’ve been bringing this up for a few months now, however.
The chart shows a sizable decline in the total Labor Force along with a decline in the number employed. While both numbers have fallen, the math gives the impression that the unemployment number is improving because of the pace of decline from the Labor Force is declining slightly faster than those employed.
he numbers are starting to add up, and this is what caught Wall Street’s attention. The math adds up to being about 0.8% additional unemployed, which at 4.2%, that would bring the total over 5.00%.
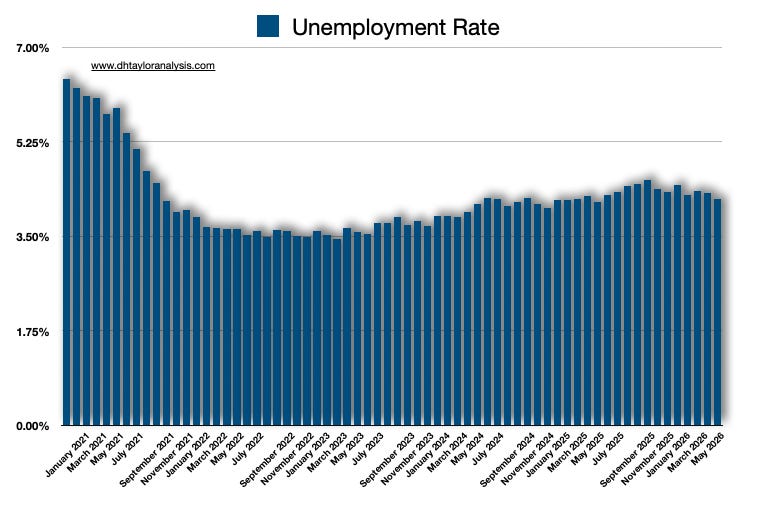
This chart shows the unemployment rate, and this is the simple math of those not employed versus the total Labor Force. Again, looking at the unemployed without taking a bigger dive into the numbers, it would be easy to be mislead.
If you do a deeper dive into the overall employment situation, you see that employment is actually declining measurably, and the end result will be a decline in overall economic activity—the economy is slowing.
Understanding the breakdown of the Labor Force, and those within it, gives a better understanding of what is going on with labor, and the employment / unemployment rate.
Breaking Down The Labor Force
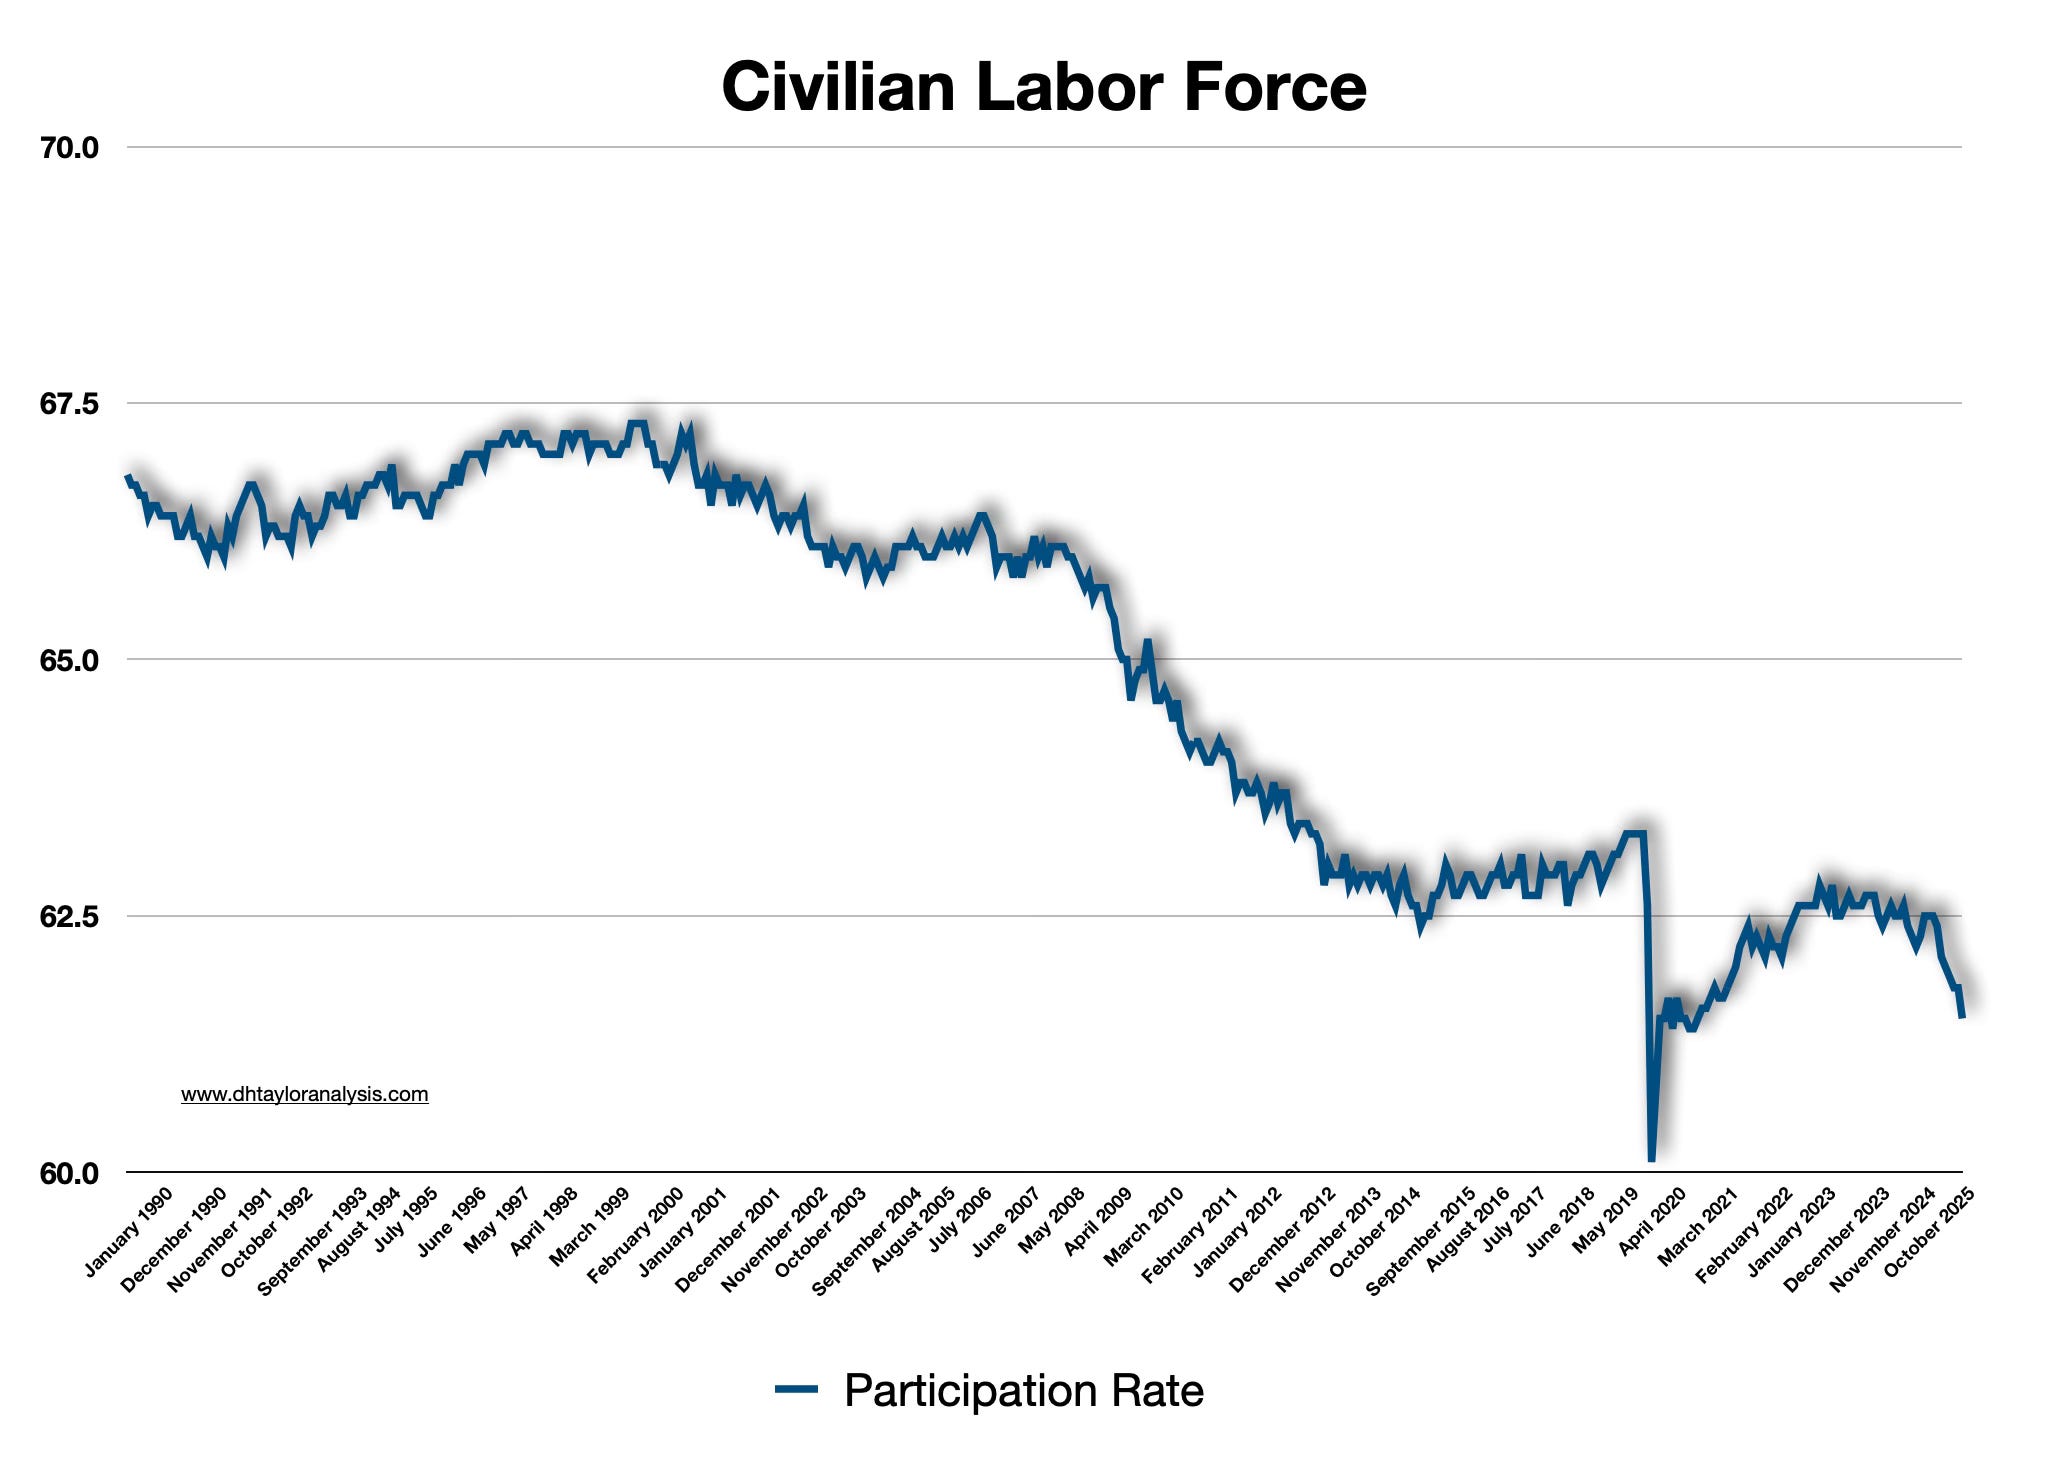
First, the Labor Force is declining—you need to understand what is happening here before anything else.
The Labor Force is the total number of people who are employed, or want a job. If you are working, even marginally, you are counted in the Labor Force as employed. You are removed after a number of weeks if you have not gotten a job. The thinking is that if you really wanted a job, at the very least, you’d go flip burgers as a last resort-even if you have a PhD in quantum physics.
Given the above chart, then, a lot of individuals are no longer being counted within the Labor Force as wanting jobs, and therefore the Labor Force is declining on a whole.
What is important to keep in mind is who is no longer working. This chart shows a different picture in that there’s an age group that while they have seen a decline over the past couple of months, overall employment is strong. The age group? Prime workers between the ages of 25 - 54:
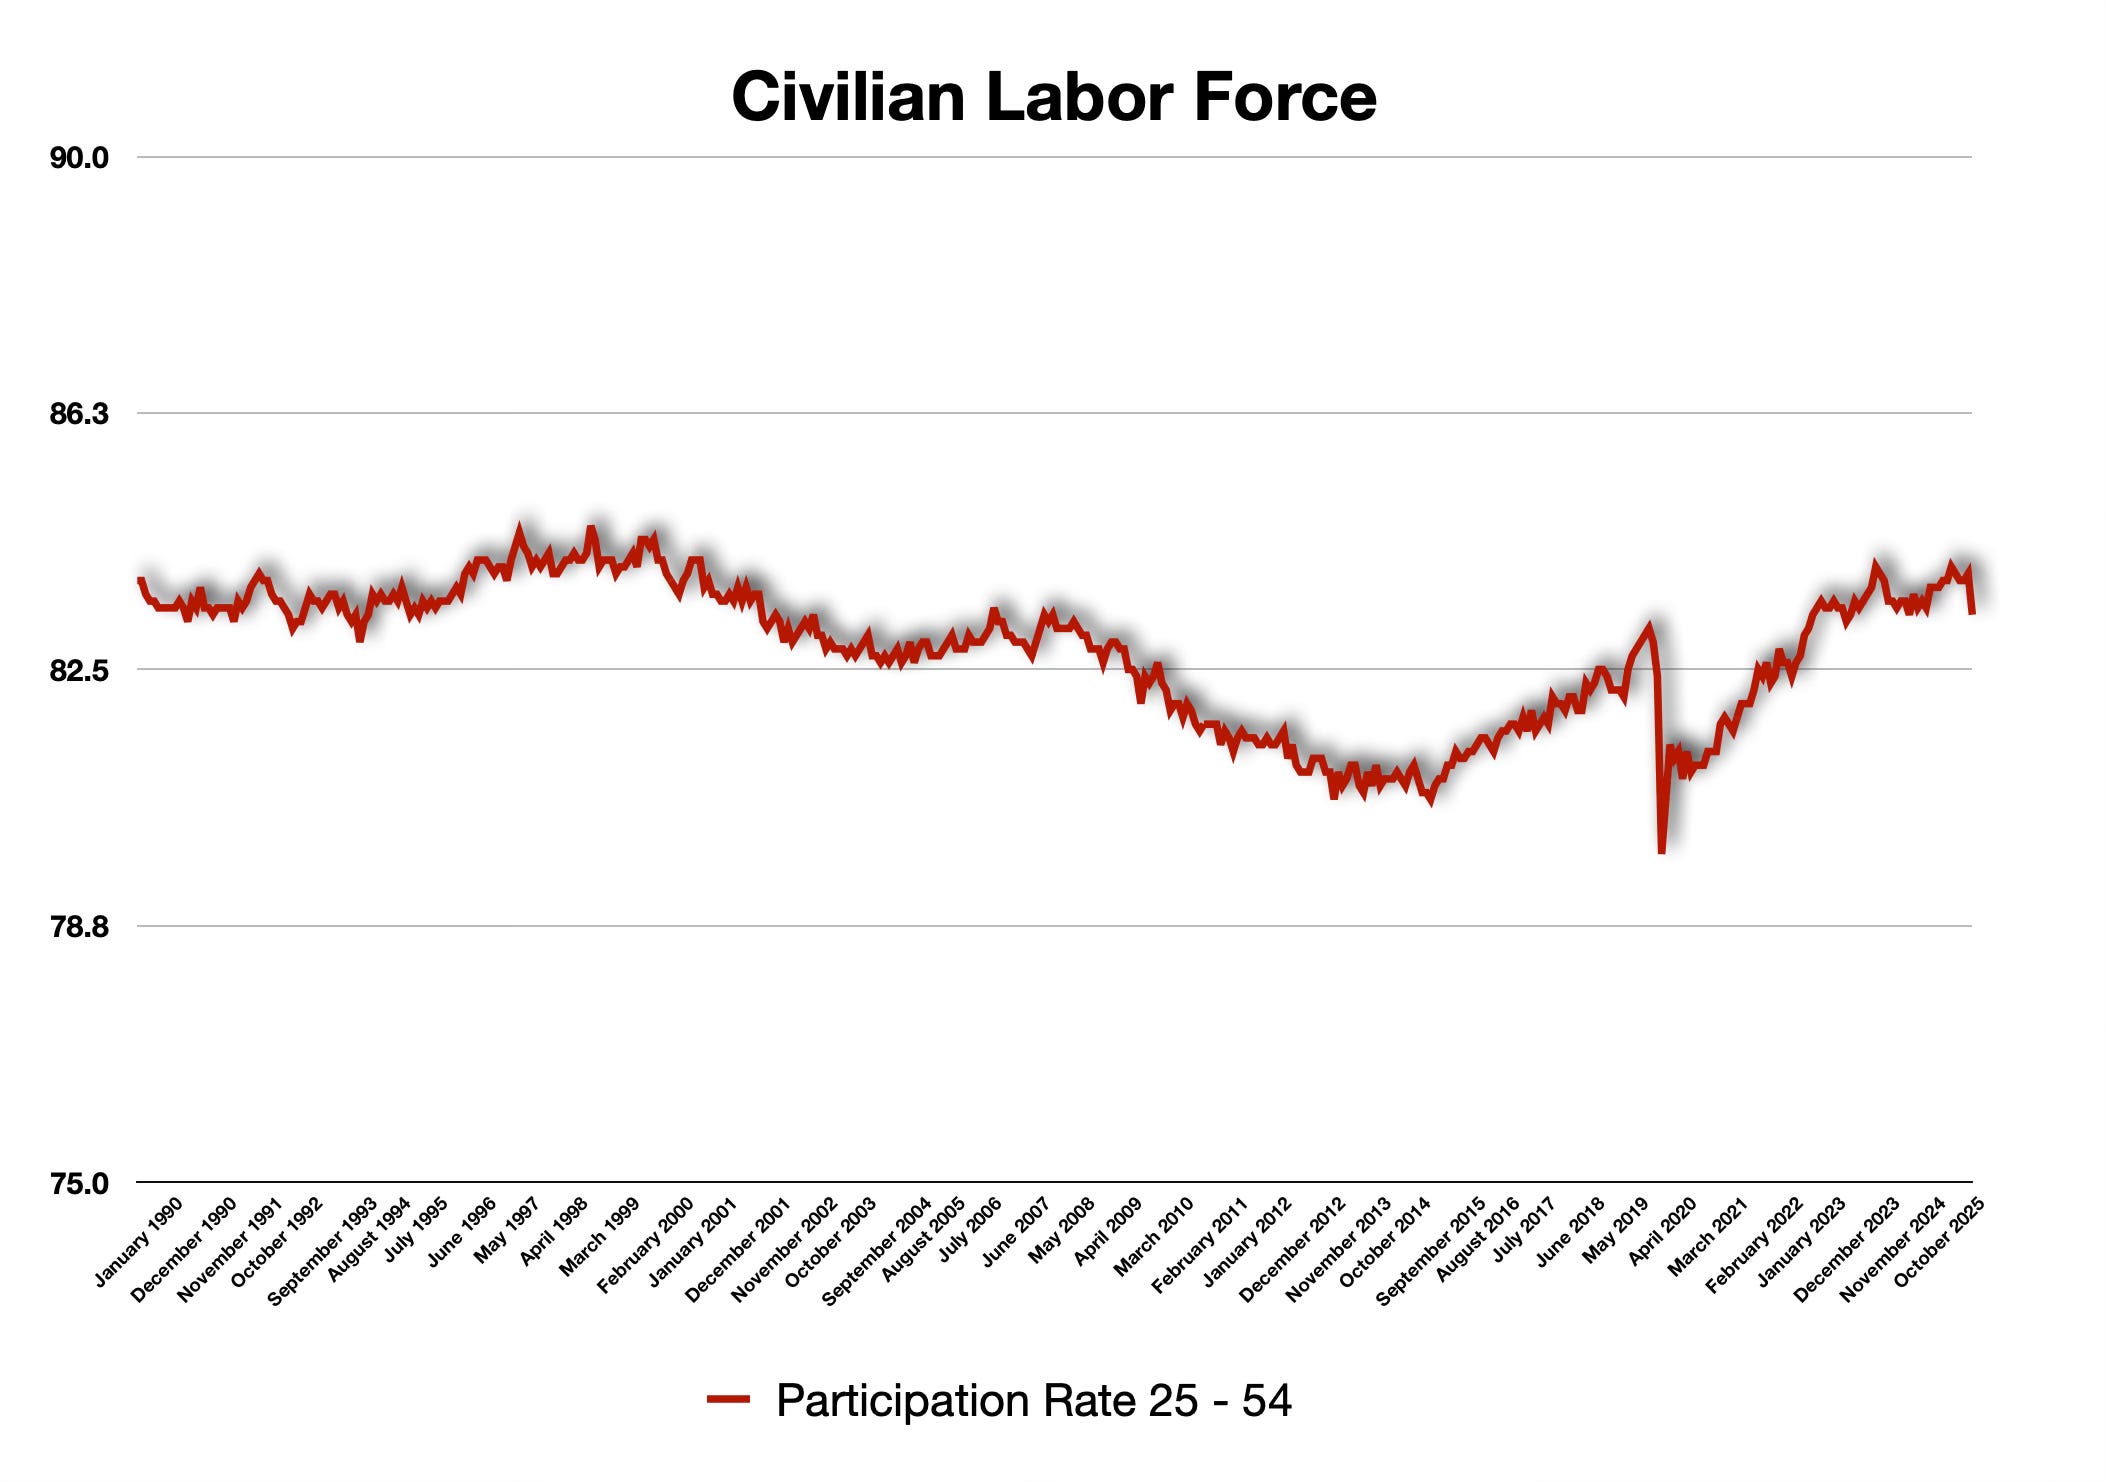
On the one hand, those in their prime age are still largely employed—good news—which means those who are actually dropping out are no longer in their prime age, and likely over the ages of 55, which means they are close to retirement. This turns out to be not-so-good news.
If you are in a higher age category, and you are unemployed, your likelihood of getting a job is far lower than other groups. In some cases, these workers may simply be retiring out, but in other cases, these individuals are going to have a far more difficult time getting a job. Because of this, they will likely no longer be in the job market, and that is a missed opportunity for the economy.
Personal incomes are driven by the total income earned by employees and the self-employed. If enough of a percentage of the population are no longer earning income, that adds up to less aggregate economic demand.
Personal Income Growth, or the lack thereof
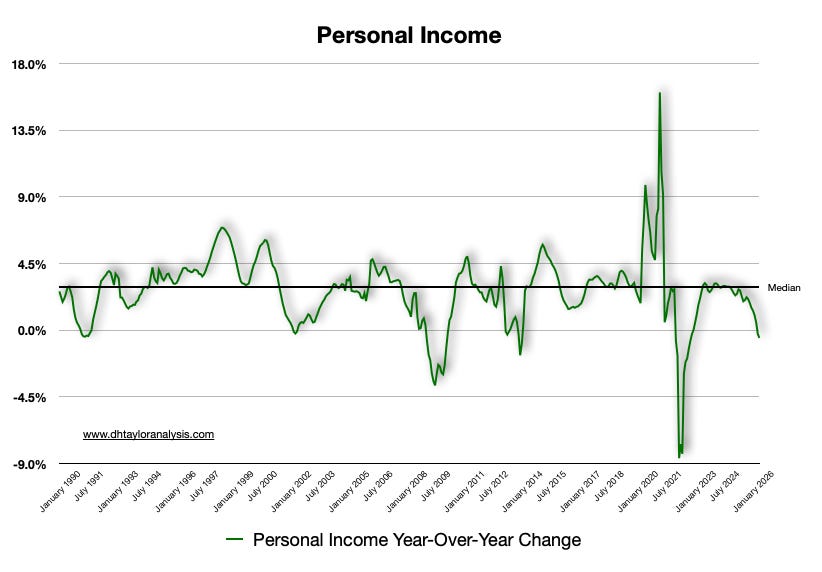
This is the chart that I pay attention to a great deal, and this chart is telling me that the economy is going to contract noticeably. Personal incomes are now negative on a year-over-year basis, and because of that, expenditures will follow suit.
Keep in mind that expenditures, which are driven by the total earned by those employed or self-employed, turn into revenue for businesses. If the rate of growth of revenue declines, profits will stall, or decline, and stock prices will follow suit.
Equity Markets
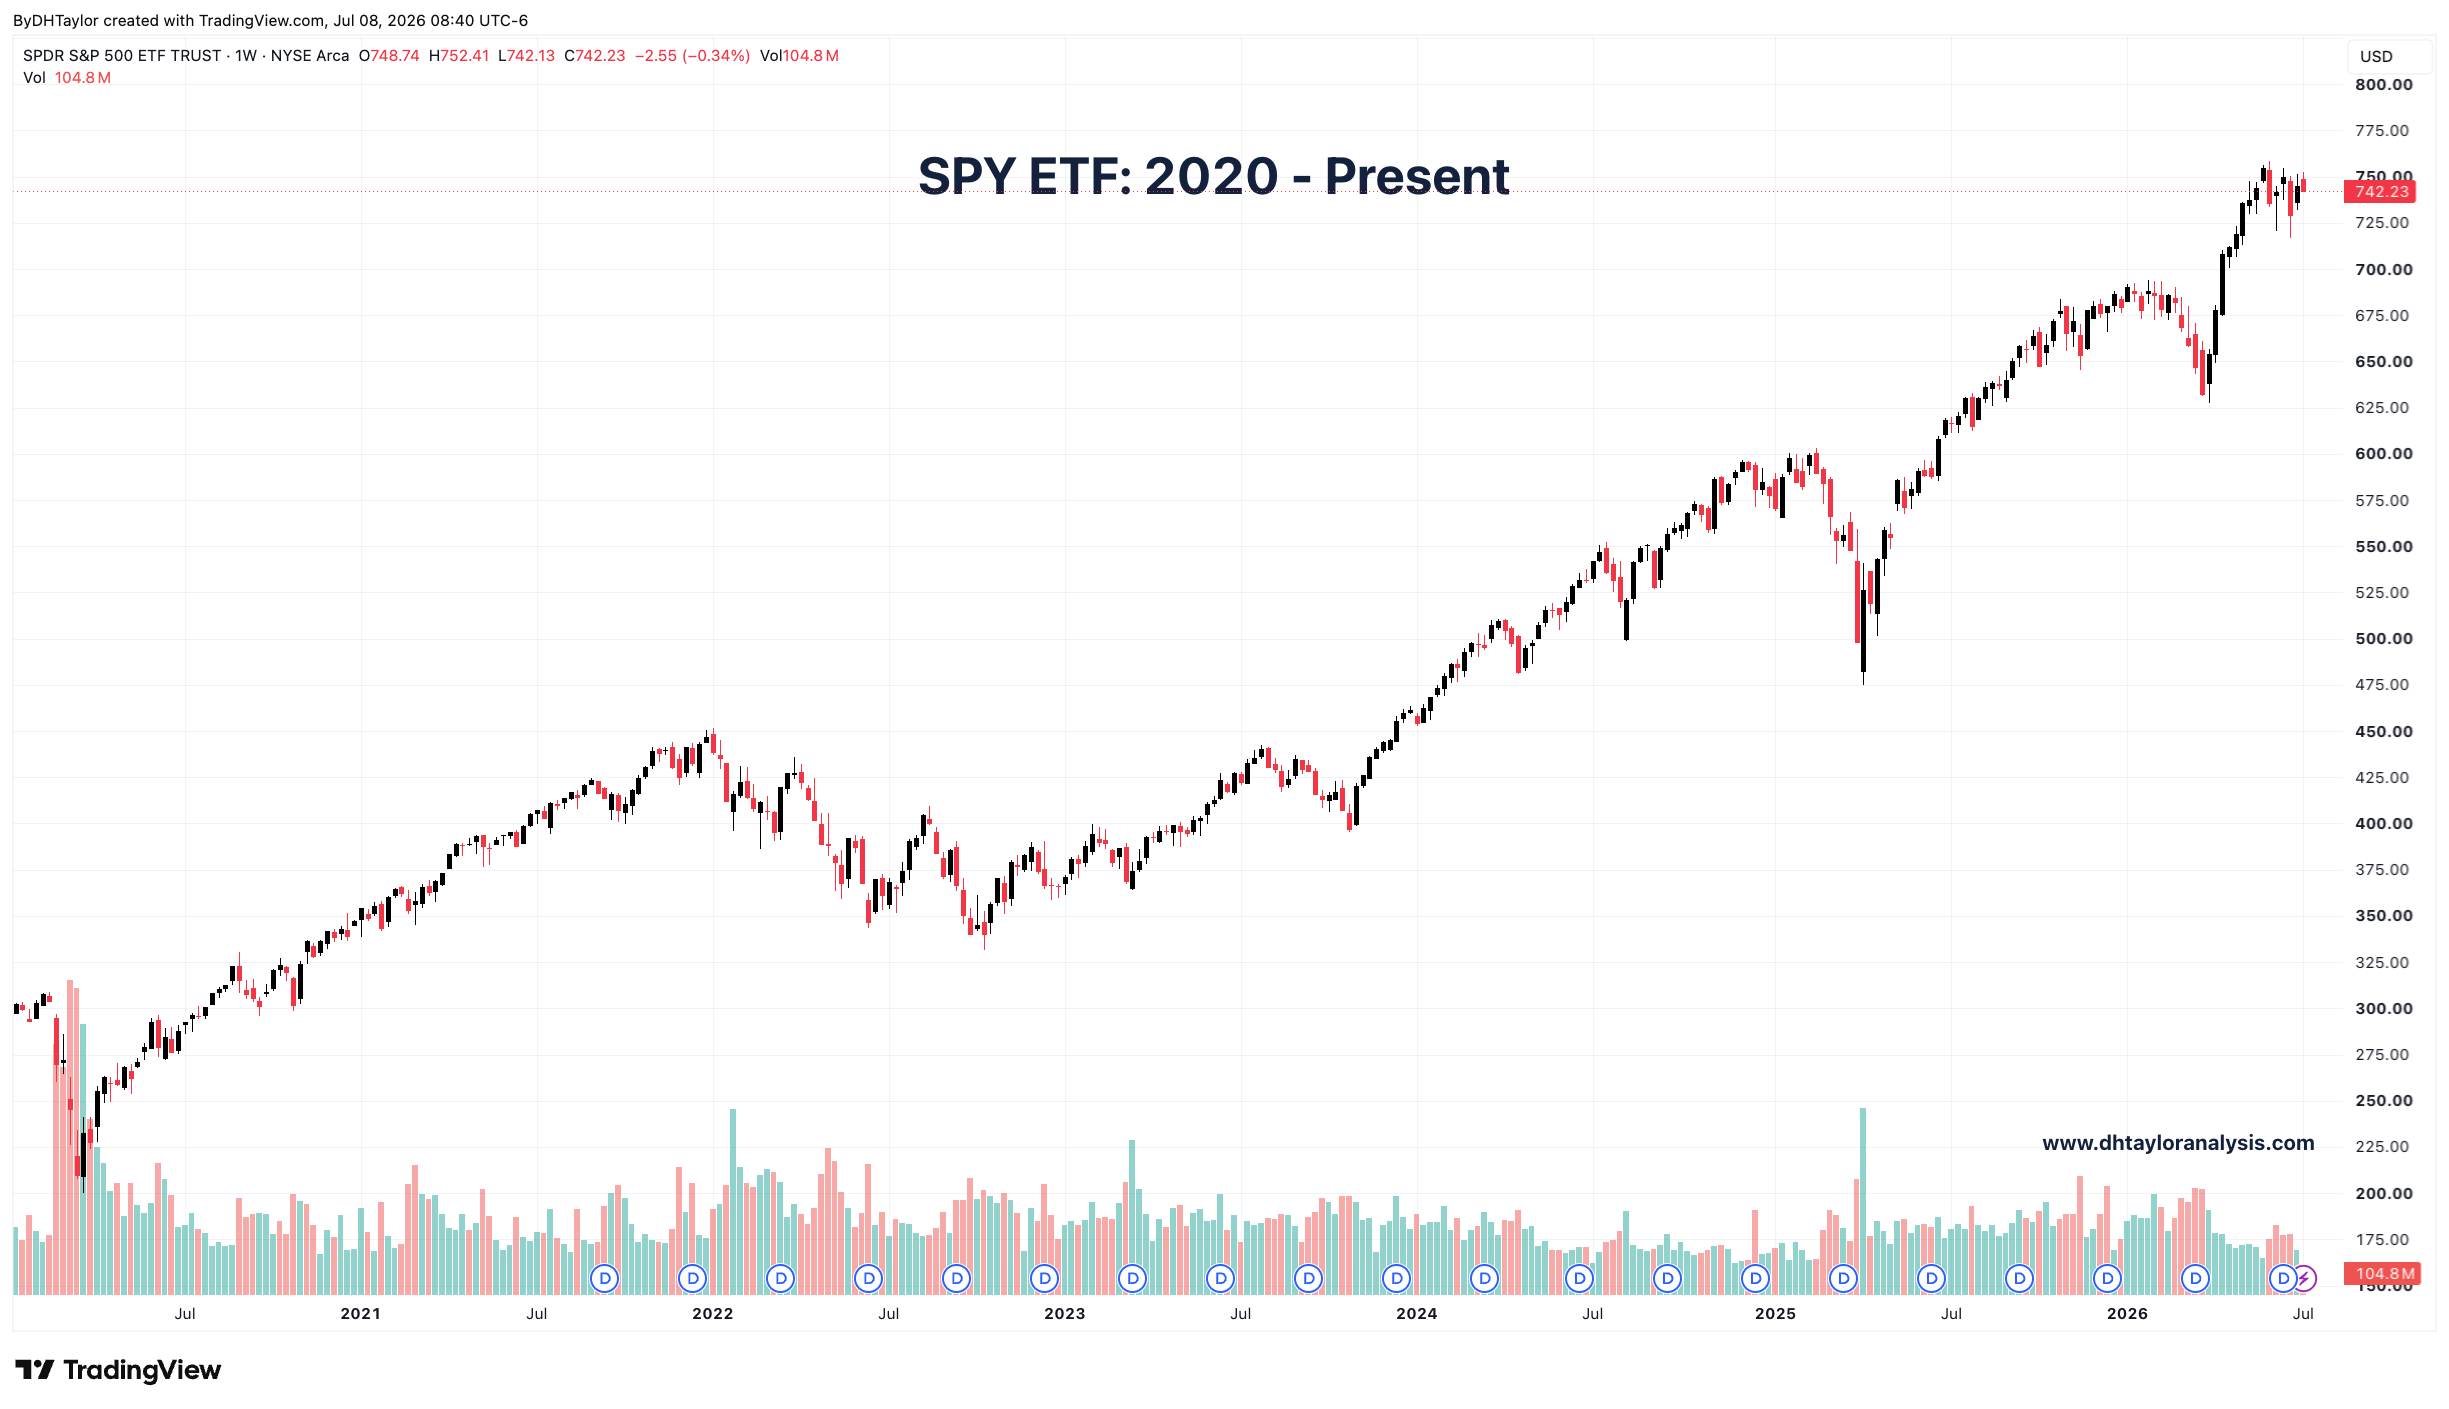
Looking at the equity markets, there is one particular area that any analysis should focus on, and that is the moment the stock market really accelerated to where it is now: October - November, 2023.
In October of 2023, the Federal Reserve signaled that they were likely to keep rates at their current levels, and from there begin the process of easing interest rates to more accommodative levels. The stock market moved up on this information, but that was not the biggest driver of what was to come.
In November of 2023, OpenAI announced it had a ‘conversation-like’ software platform that began what we now call AI, and the AI trade. With both AI and lower interest rates, a massive move higher in stocks took place from that point until where we are now.
Now, however, the fundamentals that have driven the stock market higher are in question.
First, the economy will moderate because of higher and higher consumer prices driven by the tariffs and the demand for overall commodity prices from the AI trade—The consumer can only be squeezed and diminished so much before capitulation occurs. Anything that economic activity has added to the stock market is no longer there.
Second, the Fed is going to make matters worse with their having to bring inflation back down, which will strain disposable incomes further. Looking again at the chart above, what freed the stock market to move higher was the fall in interest rates, as well as the promise of even more liquidity.
Third, I fully believe the AI trade is about to have a reckoning. This was the biggest driver of the stock market, and any significant moves to the exits will result in substantial losses in the broader indexes.
These three key factors that allowed for the big move up in the stock market are no longer sustained, and a solid correction is very likely to occur soon, and rapidly.
How AI Buildout & Tariffs Are The Cause Of Inflation - Not Oil—yet!

Inflation is running hot. Core PCE inflation, as measured on a year-over-year change, is well above the 3.00% level and trending higher. Most are focused on the here-and-now of the oil prices shooting up, however, price pres…
My Take
I have been short the equity markets for a few months, taking smaller positions in the beginning of the year, but really accelerating my positions going into the end of this year.
The economy, which is far more than the AI trade, is wavering. With that, the stock market will falter considerably.
Meanwhile, before the economy falters, there is the inflation issue to deal with, and with Core PCE sitting well above the 3.60% level, I feel certain the next move for the Fed is to send short term interest rates back upwards. I had said all the way back in September, 2024, that the Fed, who had begun lowering interest rates, was too soon, and eventually would need to increase rates again. That time is coming—and, this is before the price of oil being pushed higher because of the ongoing conflict with Iran.
My belief is threefold: The Federal Reserve will increase interest rates to stem price increases—hence my short position on TLT ETF. Because of the increase in interest rates, this will have a downward pull on incomes and expenditures–even more than what is being seen now. With declining expenditures from consumers, this will negatively impact revenue growth and profits for companies, and the stock market will falter from this.
While that is going on, the reality of the AI trade will hit, and with that, there will be even more selling in the stock market.
The good news is that once the AI bubble bursts, prices for base commodities, which have been driven up because of AI buildout demand, will fall significantly. This will actually help the Federal Reserve even more than their own policies—I’ve got a short leash on my short position on TLT ETF.
What are your thoughts?