Increasing Prices & Employment And The Fed
Employment data showed continued strength, and now inflation data is showing upward pressure; can the Fed really lower rates?
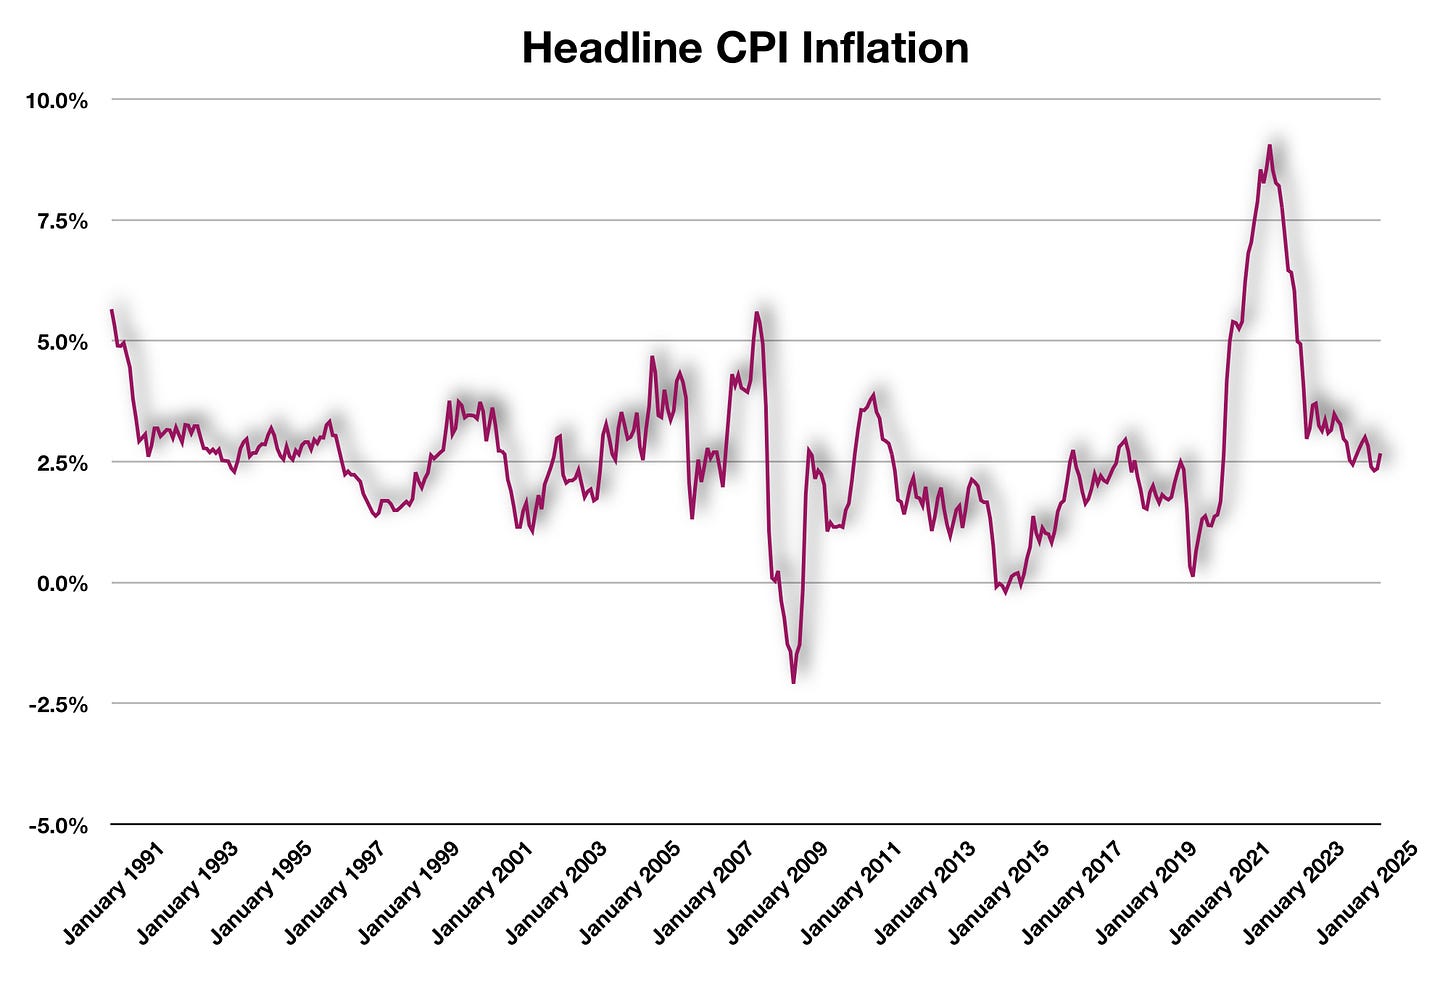
Inflation data showed up for June. Both the headline CPI Data and core CPI data showed increases, which were largely in line with expectations. The headline annual rate of increase was 2.669% whereas the core rate, the more closely-watched, increased at a faster pace of 2.934%.
On the one hand, no one data point makes an economy. On the other hand, this is foreboding as there will be increasing price pressures resulting from the tariffs.
Expectations are that the Federal Reserve will begin to lower interest rates. This is becoming a tough call.
The very first thing to watch is neither the employment rate nor inflation. These are both effects, not causes.
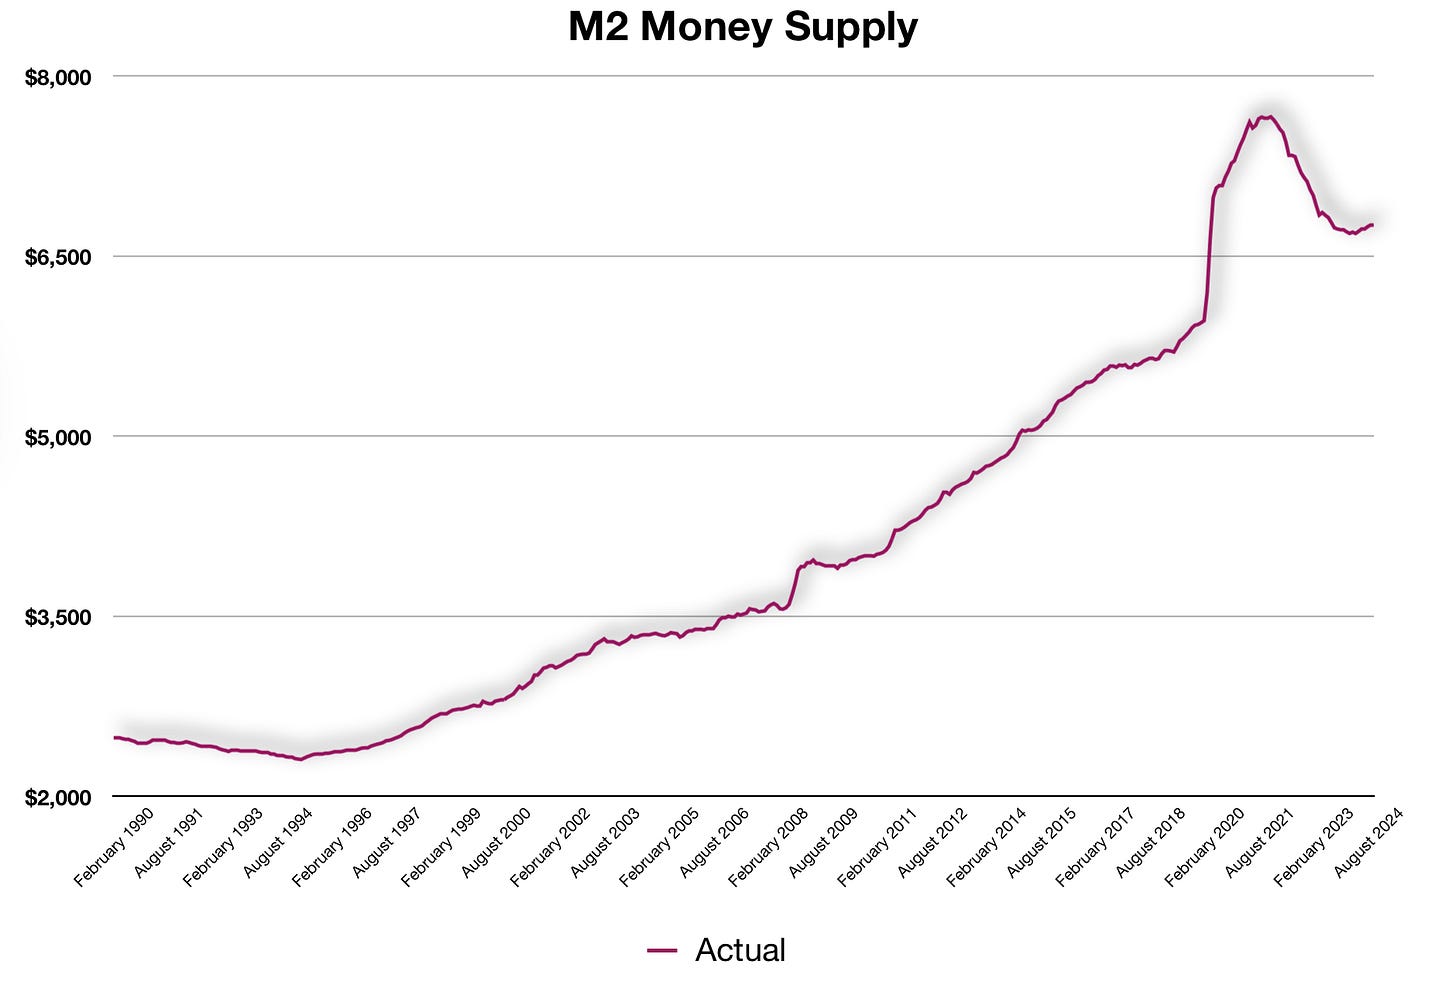
The real issue is the money supply and its growth. The Federal Reserve created a massive bubble of money, and it’s clearly visible in the M2 Money Supply:
The chart above shows the overall M2 Money Supply on an inflation-adjusted basis going back to 1990. The bulge at the end of the curve is the result of the Federal Reserve injecting trillions into the economy in response to the COVID lockdowns.
The Fed has been attempting to bring the economy back into a straight-line trajectory. However, after oversteering in one direction, getting back to neutral is proving to be difficult.
Understanding how money affects the economy can help predict what might happen next with policy.
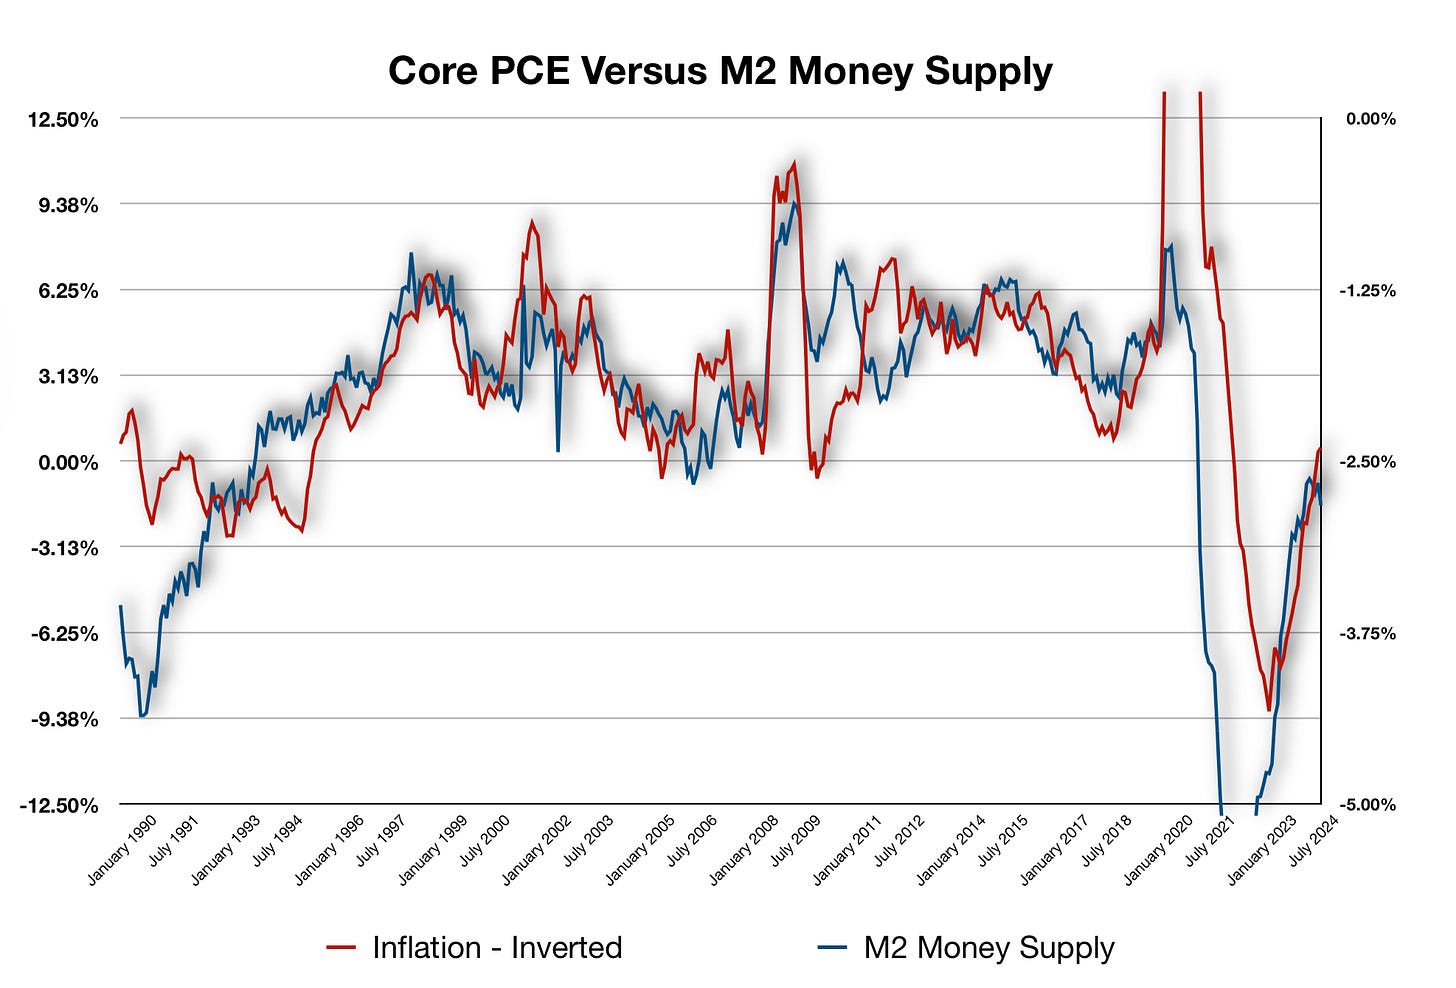
Looking at how the money supply affects price pressures is one of the first steps:
The year-over-year growth rate is one of the biggest keys to economic analysis. On an annual basis, if the money supply is increasing or decreasing at a faster pace, this means money is either flooding into or contracting within the economy.
In our current economic landscape, the money supply is growing at a rapid pace. There is more and more money being created in the economy — this is from banks and fractional banking, which means more money for businesses to add jobs. That leads to higher employment, which we have seen.
More money in the economy translates to increased consumption, which puts upward pressure on prices. After all of that, tariffs are on the way. Tariffs are a tax, and the added costs will be passed down to consumers. Within that, there will be two types of cost increases: Immediate cost increases from consumers buying a good directly from the manufacturer, and secondary cost increases from producers buying raw or intermediate goods.
What can the Fed do?
In place of raising interest rates, one of the tools available to the Federal Reserve that is often overlooked is reducing its balance sheet. The Fed is reducing its balance sheet now, but had slowed the pace of this over the past months.
If the Fed were to increase the rate of its balance sheet reduction, this would lower aggregate demand for consumers by increasing interest rates—if there is a decreasing amount of liquidity in the system, interest rates would have to go higher in response. Those interest rate increases would show up in the longer-dated yields, and while this is occurring, the Fed could toss a bone to the Executive branch.
For now, the bond market is selling off in response to this morning’s data points:
The US 10-Year Treasury yield has spiked back up, and 4.50% is just on the cusp. If the bond market believes the Fed will not be able to lower interest rates as much, while also facing a pending wall of debt on the way from the Treasury, longer-dated yields will remain elevated.
Ultimately, I am on the same page as I have been for some time: Longer-dated interest rates will remain elevated. The United States had enjoyed ultra-low interest rates in response to the COVID lockdowns. Those days are gone as the economy moves toward a more natural bond rate level. Adding in a significant increase in debt levels, this may outpace demand, which means interest rates will continue to remain high.
Meanwhile, the Stock Market
Overnight, SPY ETF hit yet another all-time high (SPY ETF: 627.99). For now, the equity market has sold off from this high on the inflation data.
My Trades
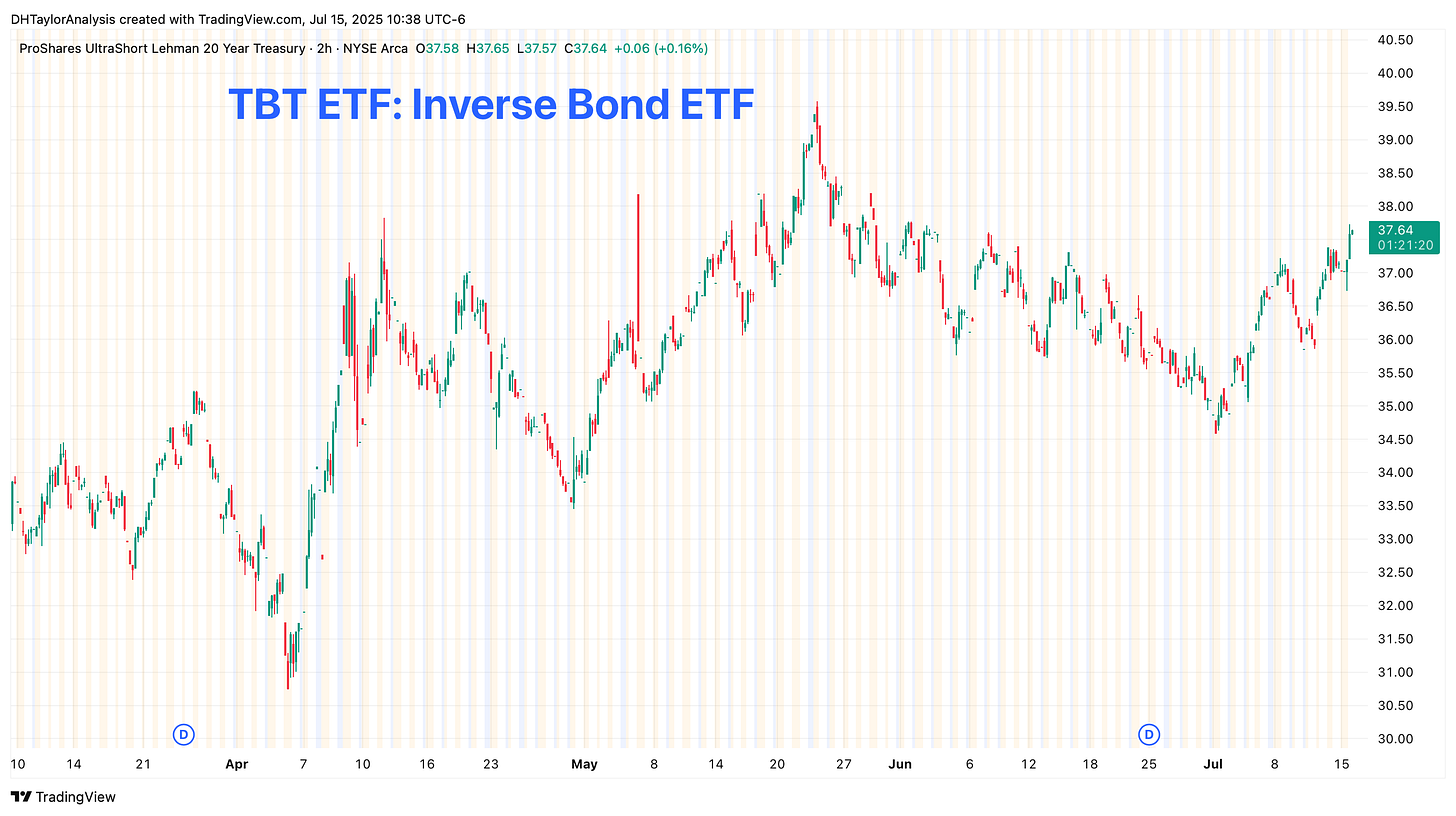
I still hold my main long-term trade of being short bonds: I am long TBT ETF, an inverse ETF. Prior to the jobs data before the 4th of July, I had wanted to sell into TLT ETF if the market moved higher on weaker jobs. As I stated in the video, if the jobs data weakened, I would sell a vertical call spread with the overall expectation that any move up in TLT would be short-lived at best. As we all know now, the jobs data showed stronger-than-expected gains, and TLT ETF continued lower.
My TBT ETF has not moved much, and I continue to sell covered calls against this position to bring in premium. I expect over time that the bond market will sell further, and long-dated interest rates will remain elevated.
I am actually ‘short’ SPY ETF and have been for a few days using a long vertical put spread. Again, I am ‘covering’ this with selling options against this to cover the costs of the premium on the options. My take is that with all of the tariff noise, stocks cannot continue to remain elevated, yet they make new highs.
Along with these trades, I am moving more and more into long gold. With inflation increasing and the likelihood that the Fed cannot lower interest rates significantly, this will continue to push gold higher in response. The move in the dollar will be interesting, and something I am following closely as I am also long yen.


What is your opinion regarding physical gold vs gold mining stocks. YTD GDX has seen a significant premium over GLD. Any insight on the anticipated behavior of both options would be appreciated. Thx
informative and insightful as always!